Infographics
Infographics are topping the charts and gaining popularity points in business life. Seasoned and well-known marketing voices predict that the use of infographics will grow and grow. The amount of information is growing every minute and therefore the demand for an effective form of communication increases as well.
Did you know that an average person is exposed to information that corresponds to 174 newspapers every day? That’s why some sociologists call people living today in this age for “informavores” (development of carnivores, which means carnivorous), ie organisms that devour information.
INFOGRAPHICS IN MOTION
The term infographic covers the combination of information combined with graphics. That means that an infographic video is a combination of information and graphics put in motion – and most often with sound added too.
Infographics are often used in newspapers to explain different complicated subjects and to create an easy to understand overview of complex information.
And infographic videos are indeed very effective for create a quick overview – and to explain complex stuff in a simple and entertaining manner.
WHY YOU SHOULD GET An infographic
COMPANIES NEED COMMUNICATION THAT WORKS
That is why communication that is easy to understand, quick to grasp and awakens our curiosity is a great solution for companies. And that’s why they increasingly make use of infographics as part of their communication strategy.
We need communication that is EASY to understand. A form of communication where the message can be consumed in one mouthful and memorized afterwards. A form of communication that, at the same time, can tell a story. And that is exactly what a good infographic can do.
INFOGRAPHIC THAT SAVED LIVES
Did you know that the famous nurse “Florence Nightingale” (1820-1910), who is especially known for her work during the Crimean War, was a master of creating infographics?
With the “Coxcomb” -infographic she tried to show and emphasize the importance of improving the sanitary conditions in hospitals, so fewer soldiers lost their lives.
PART OF CONTENT MARKETING
Most companies use infographics as part of their content marketing strategy. They use infographics to explain complex topics and create content marketing. They embed the infographics on their websites and share them on their social channels to explain business, strategy, products and the like.
Content marketing is a general term for marketing that is focuses on production and sharing of content to attract and engage clearly defined potential audience. Content marketing is also about creating and sharing content of high quality to create new and profitable customer relationships and for that infographics are ideal.
MOST USED FORMAT
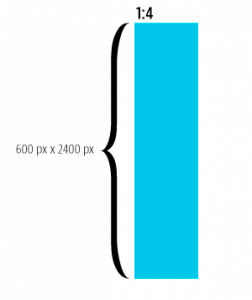
FORMAT: Most infographics are vertical. That’s because infographics are created for websites and social media, where they’re easy to read and share.
WIDTH AND HIGHT: An average infographic is about 600 px – 1100 px wide and 2000 px – 5000 px high.
RATIO: The most used ratio is 1:4. But there is no wrong or right measures for your visualization.
RECOMMENDED FORMAT
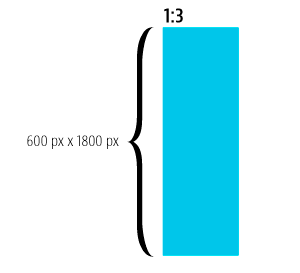
All though most infographics are 1:4, we normally recommed a ratio of 1:3.
In our experience the best format for social media is approx. 600 px x 1800 px hight and no more than 1,5 MB.
This will make it easy to grasp and easy to load and share.
THE SIZE OF A THUMB
Your users are mobile. They will likely see and read your infographic on social media on their cell phone. This means that they will se your pretty graphic on a tiny screen! That’s why it’s a good rule of thumb to create your icons and graphics in a visual style that is easy to understand. Not too many details! Because they need to look good when viewed in the size of a thumbnail (about 1,3 cm x 1,3 cm). So better simplify your visual stuff!

STORYTELLING IS THE GLUE
The word infographic is the combination of the words “information” and “graphics”. Originally they were often used in newspapers to explain complex topics and articles and provide an overview in a short time. Modern neuroscience research indicates though, that another element must be added to create a really good infographic that really speaks to your recipient’s brain in the best possible way. Namely storytelling.
Storytelling is the glue that makes illustration and information stick in the brain – and more importantly – allows the brain to find and retriece the information again. The amygdala and hippocampus play an important role in storing information.
Read more about the brain or the stages of memory.
Do you need an infographic? Contact us now
We create infographics, infographic videos and other types of corporate visualization at Levende Streg. We would love to talk to you about how we can help you and your company.

Maria Prohazka / CEO
(+45) 2818 8586
mp@levendestreg.dk

Marie Buus / Managing Partner
(+45) 2658 7434
mb@levendestreg.dk
frequently asked questions
- SUBJECT: First you find a topic for your infographic. What should it explain?
It could be "How do I share stuff on social media?", "what is a limited company?" or "how do I save up for my pension?".
- CORE MESSAGE: Find your core message. Just one!
If you choose to have several core messages you can not go into great depth with them all - there's too little space - and that confuses your receiver.
- DEFINE YOUR GOAL: What do you wish to achieve by creating your infographic?
Set up KPIs. That way it's easy to measure whether you've reached your goal.
- VISUAL STYLE: Find a style that fits your company's visual identity.
A good way to start is to find 3 infographics where you really like the style. Do they match the visual identity of your company? Why? Why not? Think about what is doable! What can you explain and illustrate in your infogracphic. Remember you don't have much space - AND it should look great on a cell phone too.
- SOURCES AND DATA
Infographics are not ment for supporting or substantiate false data. That undermines your credibility. Be accurate with your data and your sources.